📊 MCP Chart Agent
AI-powered data visualization tool that generates beautiful charts from natural language using Model Context Protocol (MCP) and Ollama
✨ Key Features
🤖 Multi-Agent System
Three specialized AI agents work together: Chart Generation, Background Creation, and Watermark Integration
💬 Natural Language
Create charts through conversational chat - just describe what you want and the AI generates it
🎨 Beautiful Visuals
Professional charts with custom backgrounds, watermarks, and multiple chart types (bar, line, pie, doughnut)
⚡ Real-Time Streaming
Watch your charts generate in real-time with streaming responses and instant feedback
📥 Export & Download
Download charts as PNG files and view underlying data in expandable tables
🔧 Open Source
Built with React, Node.js, WebSocket, Chart.js, and Ollama - fully customizable and extensible
📈 Sample Charts
Examples of charts generated by the MCP Chart Agent with professional light color gradients
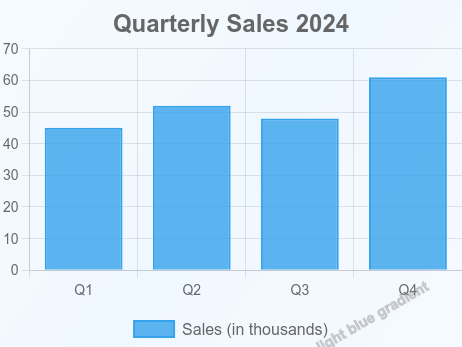
Bar Chart
Quarterly Sales 2024 - Light Blue Gradient
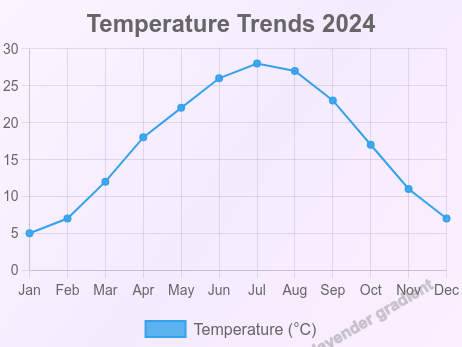
Line Chart
Temperature Trends 2024 - Lavender Gradient
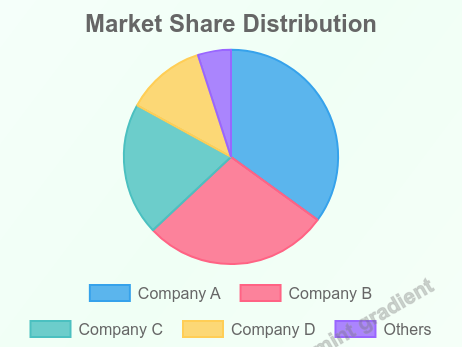
Pie Chart
Market Share Distribution - Mint Green Gradient
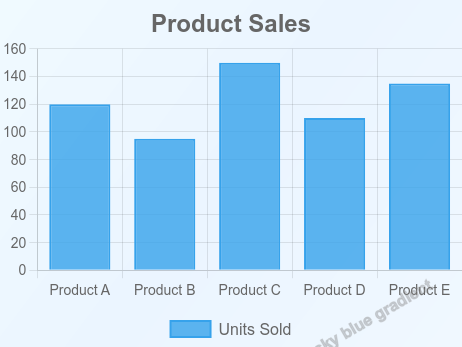
Bar Chart
Product Sales - Sky Blue Gradient
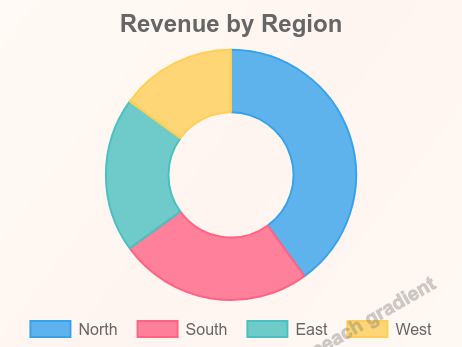
Doughnut Chart
Revenue by Region - Peach Gradient
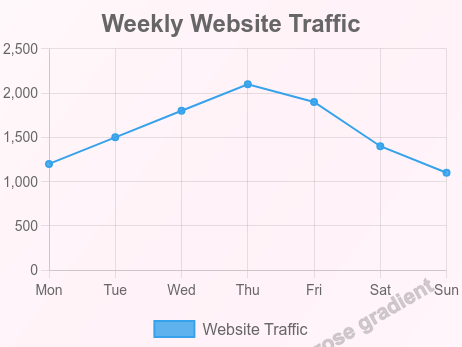
Line Chart
Weekly Website Traffic - Rose Gradient
🚀 Get Started
Explore the repository, read the documentation, or try it yourself